Show density distributions for columns of data in a matrix
Source:R/plot-density2.R
plot_density2.RdThis is an alternate to the plot_density() function using base graphics.
The advantage of this function is that it should work with most matrix-like
objects. This is especially helpful for DelayedArrays, which
plot_density() does not handle.
Usage
plot_density2(
  x,
  metadata = NULL,
  col_by = NULL,
  hcl_palette = "Dark 3",
  plot_title = NULL,
  x_label = NULL,
  y_label = "Density",
  line_weight = 1,
  line_type = 1,
  show_legend = TRUE,
  legend_position = "topright",
  legend_horiz = FALSE,
  legend_cex = 0.8,
  legend_ncol = 1,
  ...
)
Arguments
- x
feature x sample matrix or matrix-like object
- metadata
data.frame containing metadata per sample. rownames of metadata must match the colnames of the input matrix. Default NULL, each sample in the matrix will be plotted.
- col_by
metadata column used to color density lines. Default NULL, each sample in the matrix will be plotted.
- hcl_palette
color palette applied to 'col_by' variable. One of the
hcl.pals(). Default "Dark 3"- plot_title
title of the plot. Default NULL
- x_label
x-axis title. Default NULL
- y_label
y-axis title. Default "Density"
- line_weight
line weight of the density lines. Default 1
- line_type
line type of the density lines. Default 1
- show_legend
should the legend be displayed on the plot if fill_by is set? Default TRUE
- legend_position
location keyword for the legend. One of "bottomright", "bottom", "bottomleft", "left", "topleft", "top", "topright", "right" and "center". Default "topright"
- legend_horiz
logical; if TRUE, set the legend horizontally rather than vertically. Default FALSE
- legend_cex
character expansion factor for legend text relative to current par. Default 0.8
- legend_ncol
number of columns to set the legend items. Default 1. This is not used if legend_horiz=TRUE
- ...
Additional arguments not currently used.
Examples
# Create metadata for plotting
metadata <- data.frame(row.names = colnames(GSE161650_lc))
metadata$Group <- rep(c("DMSO", "THZ1"), each = 3)
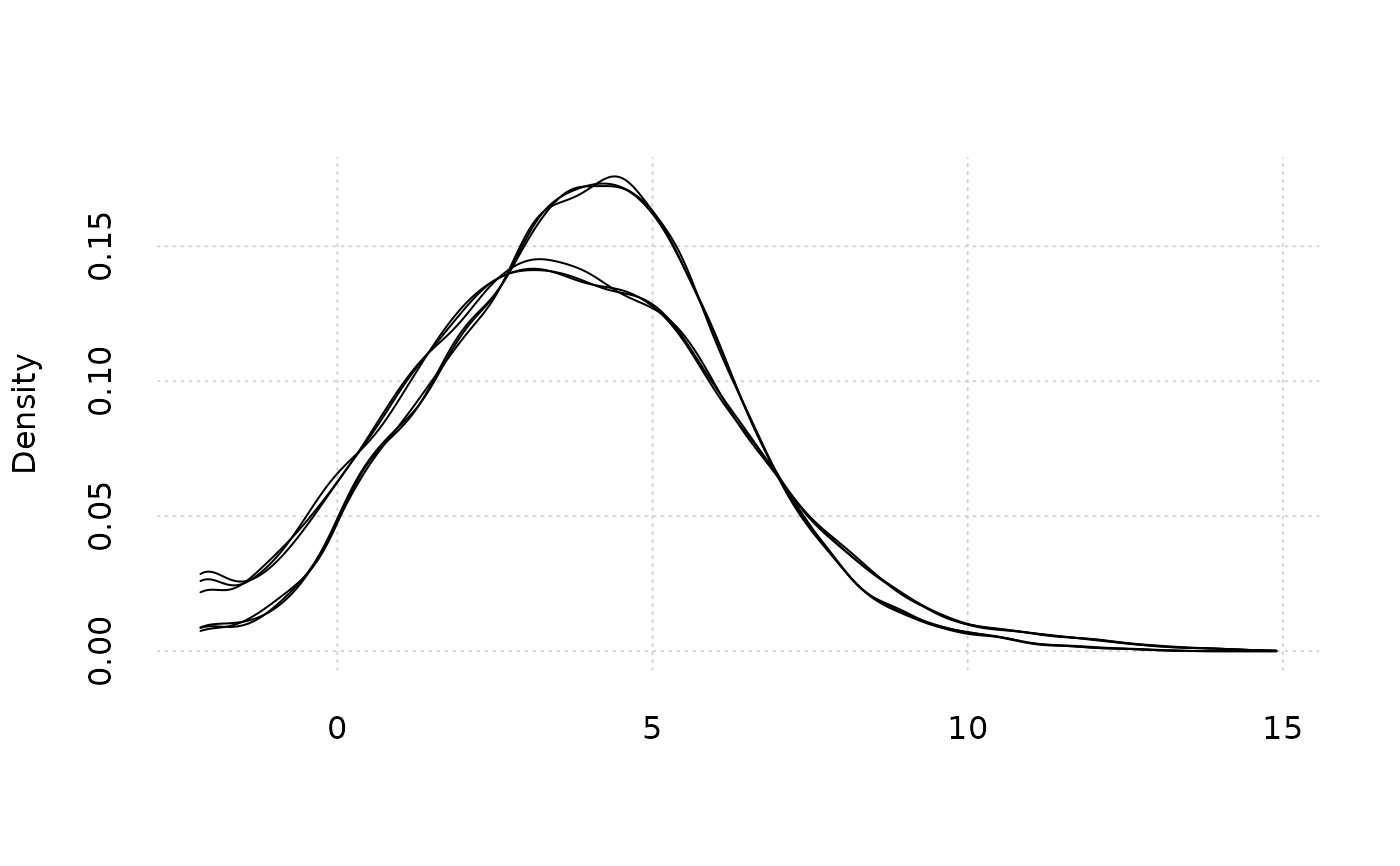
# Plot the density by sample
plot_density2(GSE161650_lc)
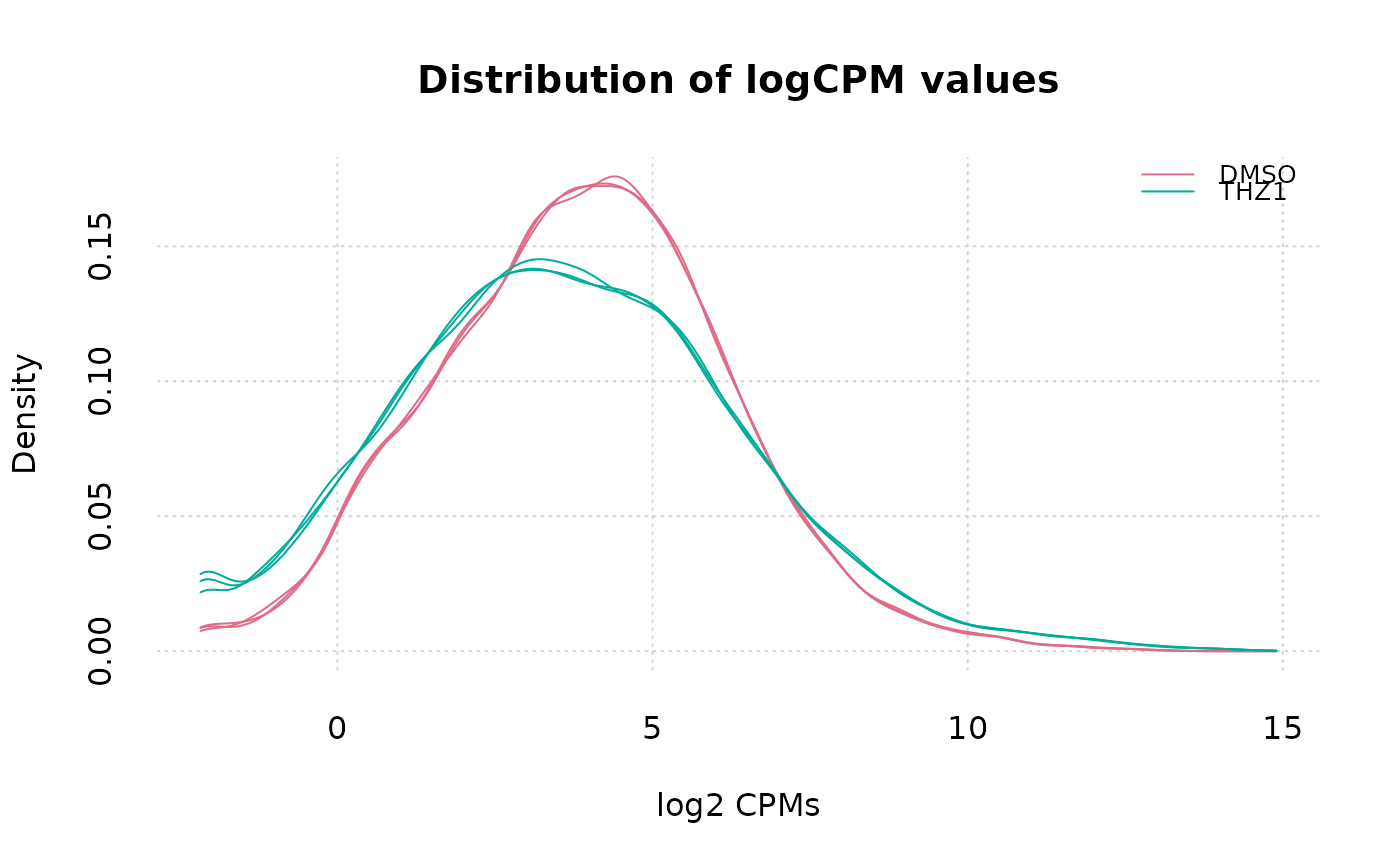
 # Color each sample by their Group in metadata
plot_density2(
GSE161650_lc,
metadata,
col_by = "Group",
x_label = "log2 CPMs",
plot_title = "Distribution of logCPM values"
)
# Color each sample by their Group in metadata
plot_density2(
GSE161650_lc,
metadata,
col_by = "Group",
x_label = "log2 CPMs",
plot_title = "Distribution of logCPM values"
)