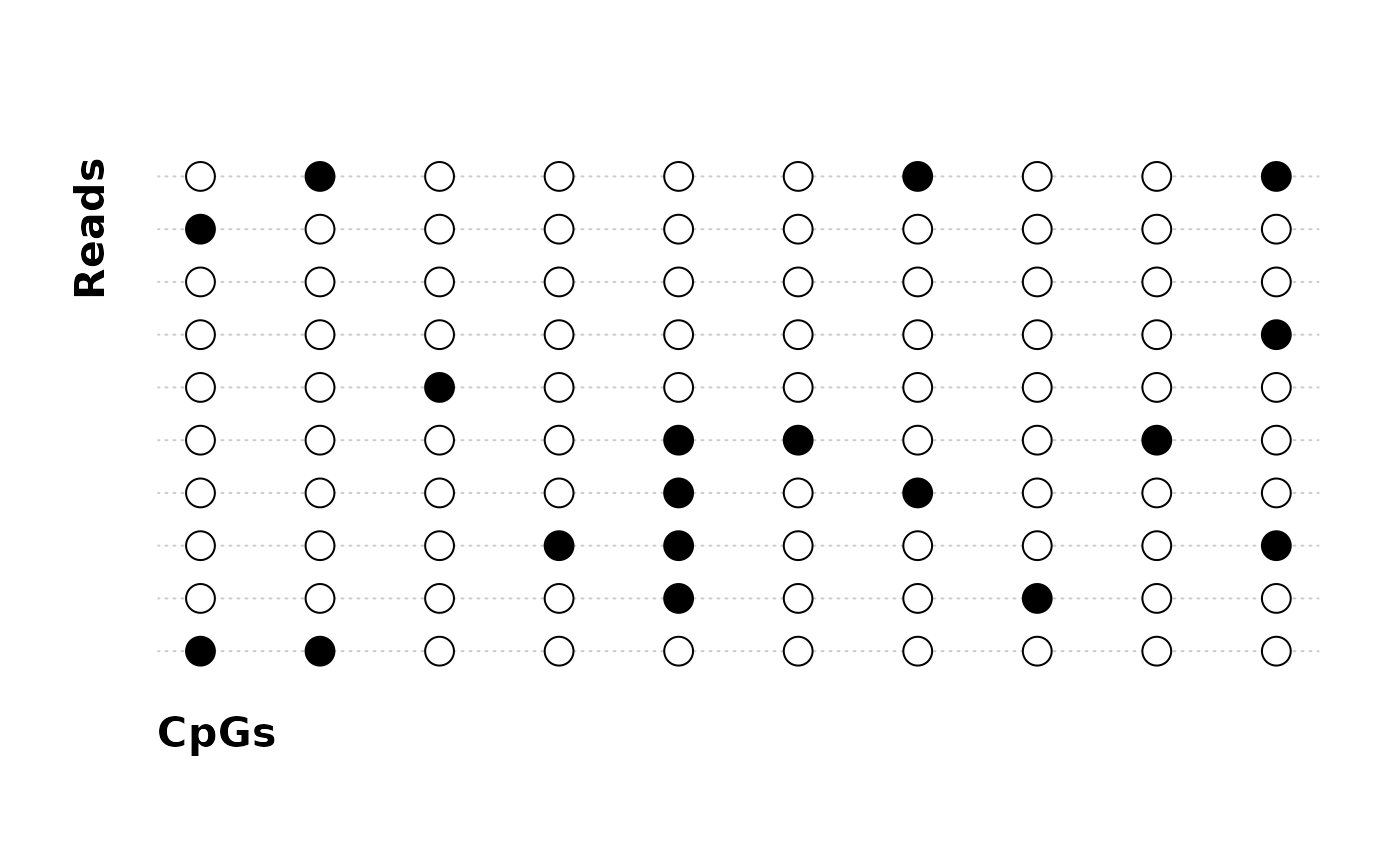
Create a methylation bead plot
Usage
plot_beads(
  x,
  m_col = "black",
  un_col = "white",
  pt_size = 1,
  x_lab = "CpGs",
  y_lab = "Reads",
  lab_cex = 1.3,
  lab_font = 2,
  lab_pos = 1.2,
  dash_col = "grey80"
)
Arguments
- x
read x CpG matrix of 0's and 1's indicating unmethylated and methylated CpGs, respectively
- m_col
bead color of methylated CpGs. default "black"
- un_col
bead color of unmethylated CpGs. default "white"
- pt_size
size of bead set by cex. default 1
- x_lab
x-axis label. default "CpGs"
- y_lab
y-axis label. default "Reads"
- lab_cex
x/y-axis label size. default 1.3
- lab_font
x/y-axis label font. default 2
- lab_pos
x/y-axis label position relative to the plot window. default 1.2
- dash_col
color of the horizontal dashed lines. default "grey80"