Create a volcano plot from a data.frame containing differential expression results.
Usage
plot_volcano(
  df,
  x = "logFC",
  y = "FDR",
  lab = NULL,
  fdr = 0.05,
  lfc = 0,
  label_sig = FALSE,
  annotate_counts = TRUE,
  up_color = "red2",
  down_color = "royalblue2",
  nonde_color = "grey40",
  up_alpha = 1,
  down_alpha = 1,
  nonde_alpha = 1,
  up_size = 1,
  down_size = 1,
  nonde_size = 1,
  up_shape = 16,
  down_shape = 16,
  nonde_shape = ".",
  xmin_label_offset = 0.8,
  xmax_label_offset = 0.8,
  ymax_label_offset = 0.9,
  lab_size = 6,
  lab_digits = 1,
  x_axis_limits = NULL,
  y_axis_limits = NULL,
  raster = FALSE,
  raster_dpi = 300,
  raster_dev = "cairo",
  ...
)
Arguments
- df
dataframe containing columns with gene names, p-values, and log-fold changes.
- x
logFC column. Default (logFC)
- y
FDR or p-value column. Default (FDR)
- lab
column containing gene id or labels. Default (NULL)
- fdr
significance level cutoff for plotting. Values below the given fdr threshold are considered significant. Default (0.05)
- lfc
log-fold-change cutoff for plotting. Values greater than the abs(lfc) and less than fdr are displayed as differentially expressed. Default (0)
- label_sig
TRUE/FALSE. apply ggrepel::geom_text_labels to significant DE genes.
- annotate_counts
TRUE/FALSE. Annotate the plot with the summarized gene counts
- up_color
Point color of the up-regulated features
- down_color
Point color of the down-regulated features
- nonde_color
Point color of the unperturbed features
- up_alpha
Point alpha of the up-regulated features
- down_alpha
Point alpha of the down-regulated features
- nonde_alpha
Point alpha of the unperturbed features
- up_size
Point size of the up-regulated features
- down_size
Point size of the down-regulated features
- nonde_size
Point size of the unperturbed features
- up_shape
Point shape of the up-regulated features
- down_shape
Point shape of the down-regulated features
- nonde_shape
Point shape of the unperturbed features
- xmin_label_offset
numeric. Value between 0 and 1 inclusive to control the x-position of the count annotation label for the 'down' counts
- xmax_label_offset
numeric. Value between 0 and 1 inclusive to control the x-position of the count annotation label for the 'up' counts
- ymax_label_offset
numeric. Value between 0 and 1 inclusive to control the y-position of the count labels.
- lab_size
numeric. Size of the label if annotate_counts = TRUE. Default 6.
- lab_digits
numeric. The number of digits used when rounding percentage values when annotate_counts=TRUE. Default (1)
- x_axis_limits
numeric vector of axis limits supplied to ggplot2::coord_cartesian(). Default (NULL)
- y_axis_limits
numeric vector of axis limits supplied to ggplot2::coord_cartesian(). Default (NULL)
- raster
Should the points in the plot be rasterized? default FALSE. If TRUE, points will be rasterized using `ggrastr`
- raster_dpi
integer Sets the desired resolution in dots per inch (default = 300)
- raster_dev
string Specifies the device used, which can be one of: "cairo", "ragg", "ragg_png" or "cairo_png" (default="cairo")
- ...
Additional arguments passed to
ggrepel::geom_text_repel
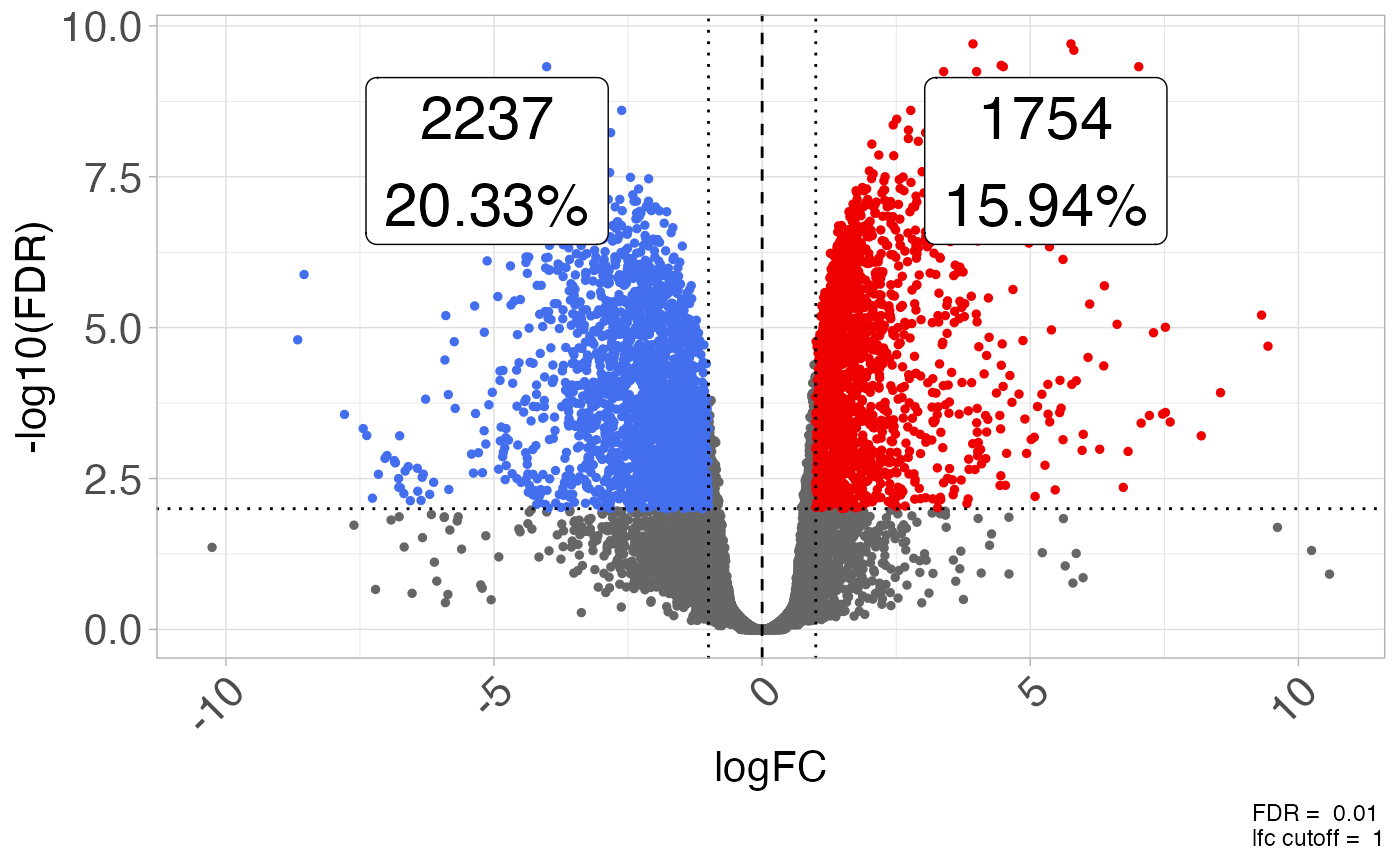
Examples
plot_volcano(GSE161650_de, fdr = 0.01, lfc = log2(2))