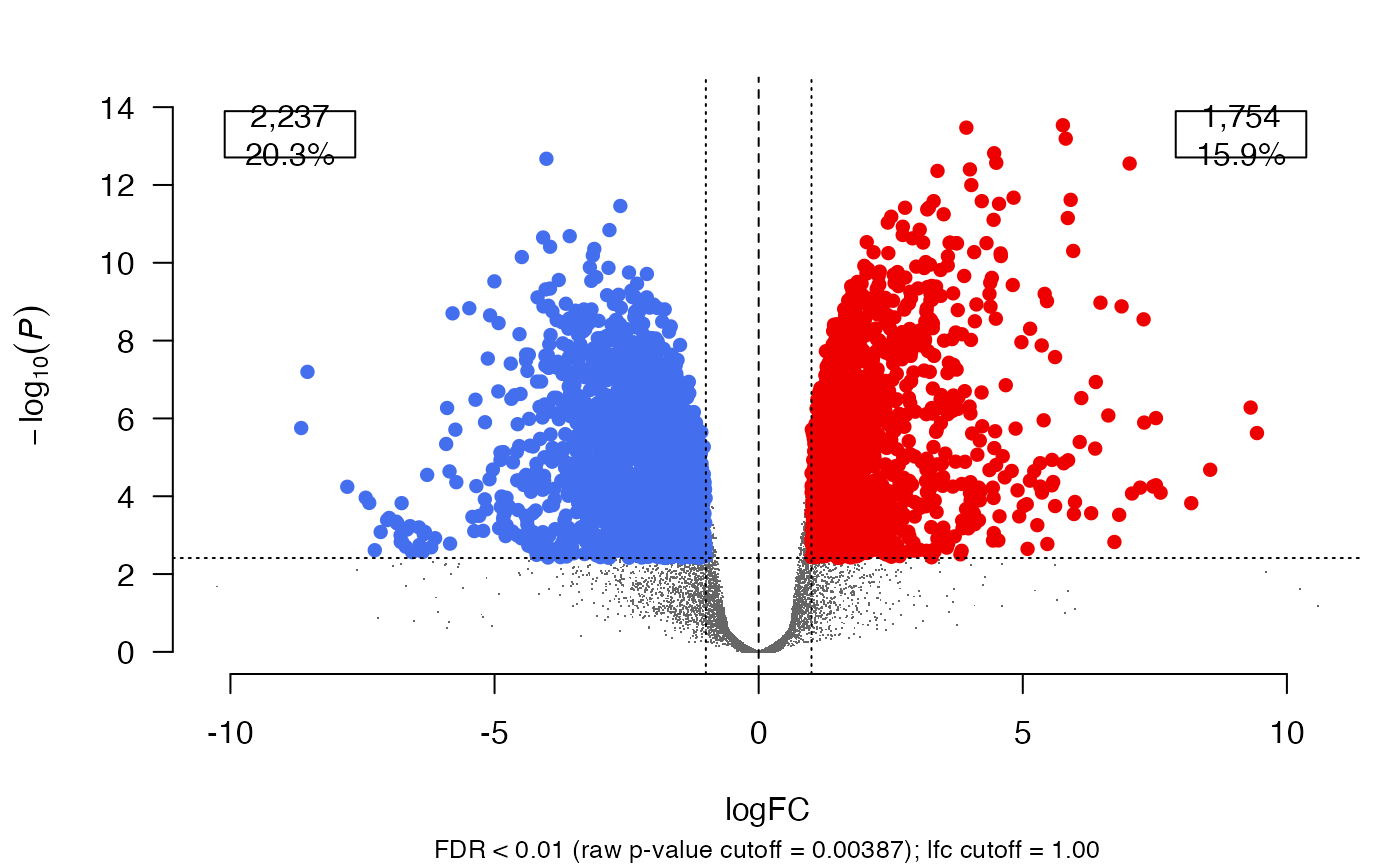
This function differs from plot_volcano() as it produces a plot in base R.
The defaults are also slightly different in that raw p-values are shown on the y-axis
however, significance thresholds are computed on the adjusted p-values. Points are
colored by adjusted p-value (and logFC) significance, and the percentage and
count of up/down features are annotated on the plot area.
Usage
plot_volcano2(
  df,
  x = "logFC",
  y = "PValue",
  y_adj = "FDR",
  lab = NULL,
  fdr = 0.1,
  lfc = log2(1),
  label_sig = FALSE,
  n_labels = 10,
  annotate_counts = TRUE,
  add_grid = FALSE,
  xmin_label_offset = 0.8,
  xmax_label_offset = 0.8,
  ymax_label_offset = 0.9,
  lab_size = 1,
  lab_digits = 1,
  up_color = "red2",
  down_color = "royalblue2",
  nonde_color = "grey40",
  up_alpha = 1,
  down_alpha = 1,
  nonde_alpha = 1,
  up_size = 1,
  down_size = 1,
  nonde_size = 1,
  up_shape = 16,
  down_shape = 16,
  nonde_shape = ".",
  x_axis_limits = NULL,
  y_axis_limits = NULL,
  ...
)
Arguments
- df
data.frame containing columns for features, significance testing values, corrected significance testing values, and effect sizes
- x
Variable to plot on the x-axis, Default "logFC"
- y
Variable to plot on the y-axis. Default "PValue"
- y_adj
Variable corresponding to the adjusted p-values used to define significance. Default "FDR"
- lab
column containing gene id or labels. Default (NULL)
- fdr
Significance threshold for features. Based on y_adj. Default 0.1
- lfc
logFC threshold for considering significant features. Features must have abs(logFC) greater than lfc. Default log2(1).
- label_sig
TRUE/FALSE. Label significant features with the values in
labusingtext().- n_labels
integer. Maximum number of features to label when label_sig = TRUE. Since base R cannot repel labels, only the
n_labelssignificant features with the most extreme combined rank of p-value and absolute logFC are labeled. Default 10- annotate_counts
TRUE/FALSE. Annotate the plot area with the percentage and count of up- and down-regulated features. Default TRUE
- add_grid
TRUE/FALSE. Draw a background grid with
grid()beneath the points. Default FALSE- xmin_label_offset
numeric. Value between 0 and 1 inclusive. Controls the x-position of the 'down' count label as a fraction of the left x-axis limit
- xmax_label_offset
numeric. Value between 0 and 1 inclusive. Controls the x-position of the 'up' count label as a fraction of the right x-axis limit
- ymax_label_offset
numeric. Value between 0 and 1 inclusive. Controls the y-position of the count labels as a fraction of the upper y-axis limit
- lab_size
numeric. Size (cex) of the count labels when annotate_counts = TRUE. Default 1
- lab_digits
numeric. The number of digits used when rounding percentage values when annotate_counts = TRUE. Default 1
- up_color
Point color of the up-regulated features
- down_color
Point color of the down-regulated features
- nonde_color
Point color of the unperturbed features
- up_alpha
Point alpha of the up-regulated features
- down_alpha
Point alpha of the down-regulated features
- nonde_alpha
Point alpha of the unperturbed features
- up_size
Point size (cex) of the up-regulated features
- down_size
Point size (cex) of the down-regulated features
- nonde_size
Point size (cex) of the unperturbed features
- up_shape
Point shape (pch) of the up-regulated features
- down_shape
Point shape (pch) of the down-regulated features
- nonde_shape
Point shape (pch) of the unperturbed features
- x_axis_limits
numeric vector of length 2 giving the x-axis limits. Default (NULL)
- y_axis_limits
numeric vector of length 2 giving the y-axis limits. Default (NULL)
- ...
Additional arguments passed to
plot(). These override the defaults (e.g.xlab,ylab,las,bty,main)
Examples
plot_volcano2(GSE161650_de, fdr = 0.01, lfc = log2(2))