Generate a heatmap using pheatmap with sensible defaults for RNA-seq.
Usage
quickmap(x, metadata = NULL, remove_var = NULL, ...)
Arguments
- x
numeric matrix to be passed onto pheatmap function
- metadata
column metadata to add to heatmap annotation. Default NULL
- remove_var
Remove this proportion of features based on variance
across rows. Default NULL.
- ...
args to be passed to pheatmap() function
Value
pheatmap object. See ?pheatmap::pheatmap() for details
Details
The default arguments to pheatmap::pheatmap() are:
scale = "row"
show_rownames = FALSE
border_col = NA
cluster_rows = TRUE
cluster_cols = TRUE
color = colorRampPalette(c("dodgerblue3", "grey99", "firebrick3"))(30)
treeheight_row = 0
clustering_distance_rows = "correlation"
clustering_distance_cols = "euclidean"
clustering_method = "ward.D2"
angle_col = 315
Examples
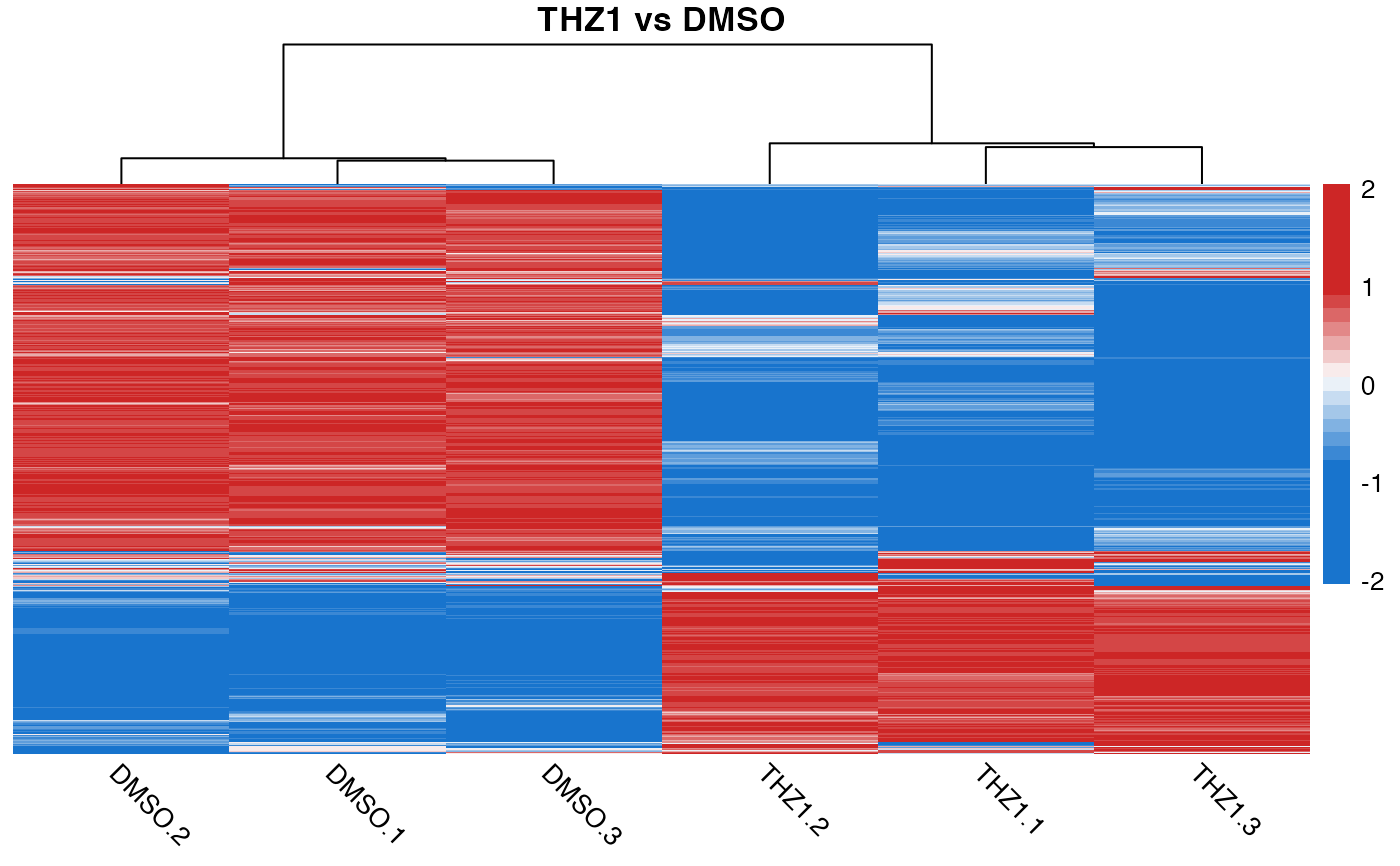
# Display heatmap of scaled count data and add title to the plot
quickmap(GSE161650_lc, main = "THZ1 vs DMSO")
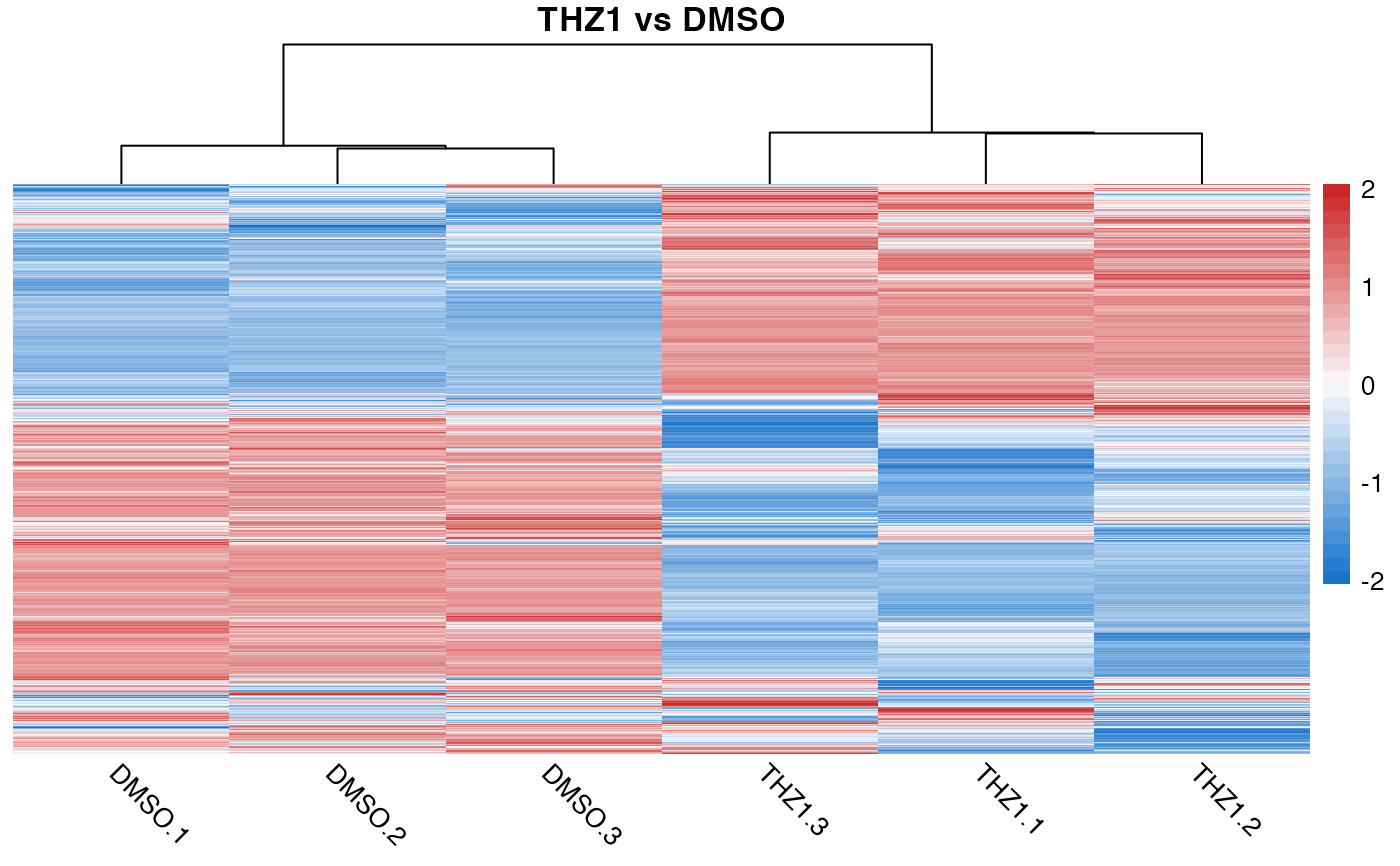 # Override quickmap defaults by supplying additional args
quickmap(GSE161650_lc, cluster_rows = FALSE, cluster_cols = FALSE)
# Override quickmap defaults by supplying additional args
quickmap(GSE161650_lc, cluster_rows = FALSE, cluster_cols = FALSE)