Calculate a threshold value of a vector based on the unimodal threshold method described by Rosin 2001 for image thresholding. Conceptually, the method attempts to draw a line from the peak of the distribution to the tail and calculates the maximum distance from a point to that line. The point where the distance is maximized is the threshold.
Details
The function takes a numeric vector and ranks the values using data.table::frank.
with ties.method = "first". The returned values for the threshold "x" and "y",
indicate the rank of the data point and the value at that rank, respectively.
Examples
# simulate exponential counts
x <- (1:100)^exp(3)
rank_threshold(x, show = TRUE)
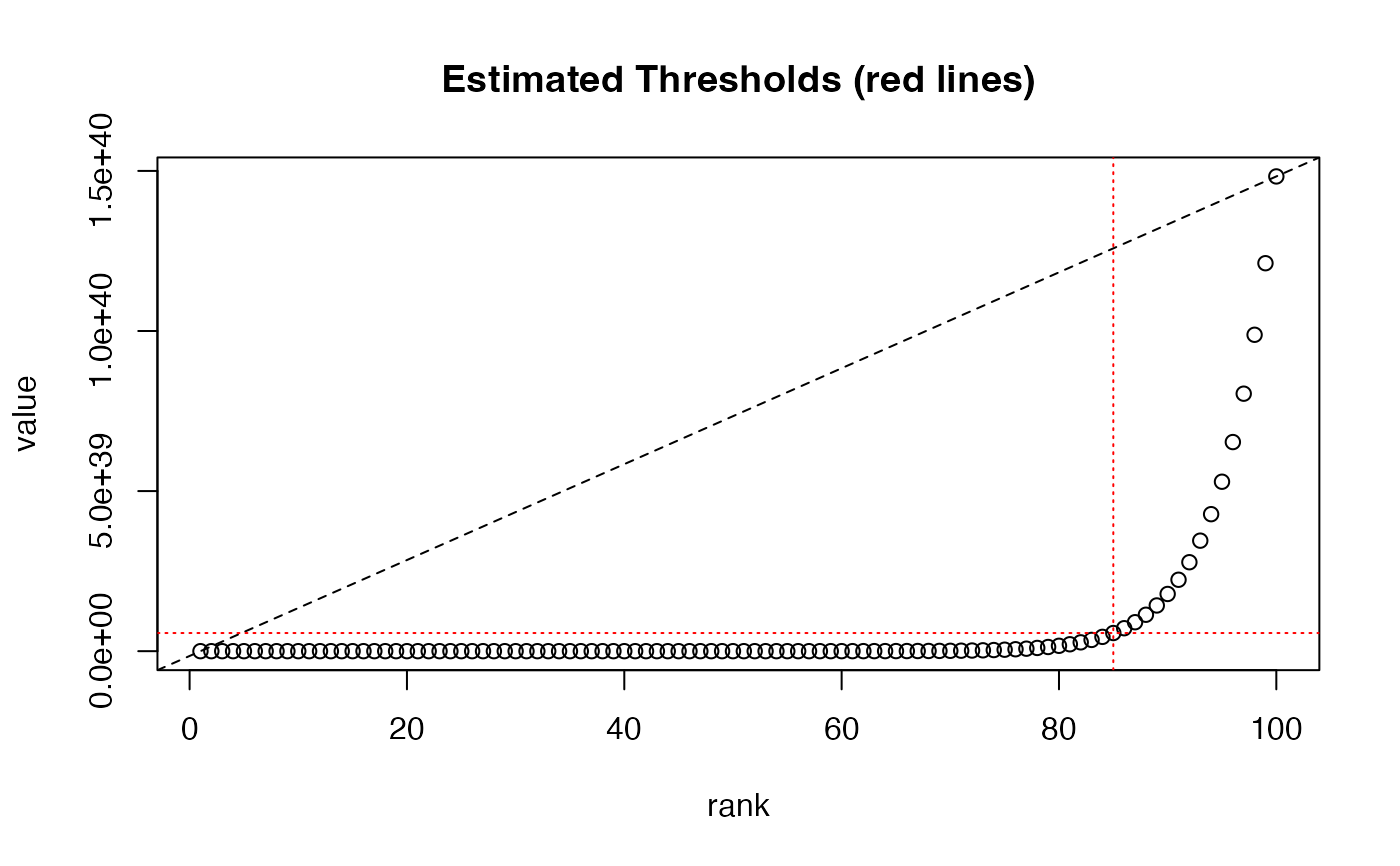 #> x y
#> 8.500000e+01 5.667807e+38
#> x y
#> 8.500000e+01 5.667807e+38