Based on ggplot2::theme_light() this theme will adjust the plot title,
legend position (bottom), axis titles, axis ticks, and strip text.
Examples
library(ggplot2)
df <- data.frame(
X = 1:100,
Y = rnorm(100),
C = sample(c("Group 1", "Group 2", "Group 3"), 100, replace = TRUE)
)
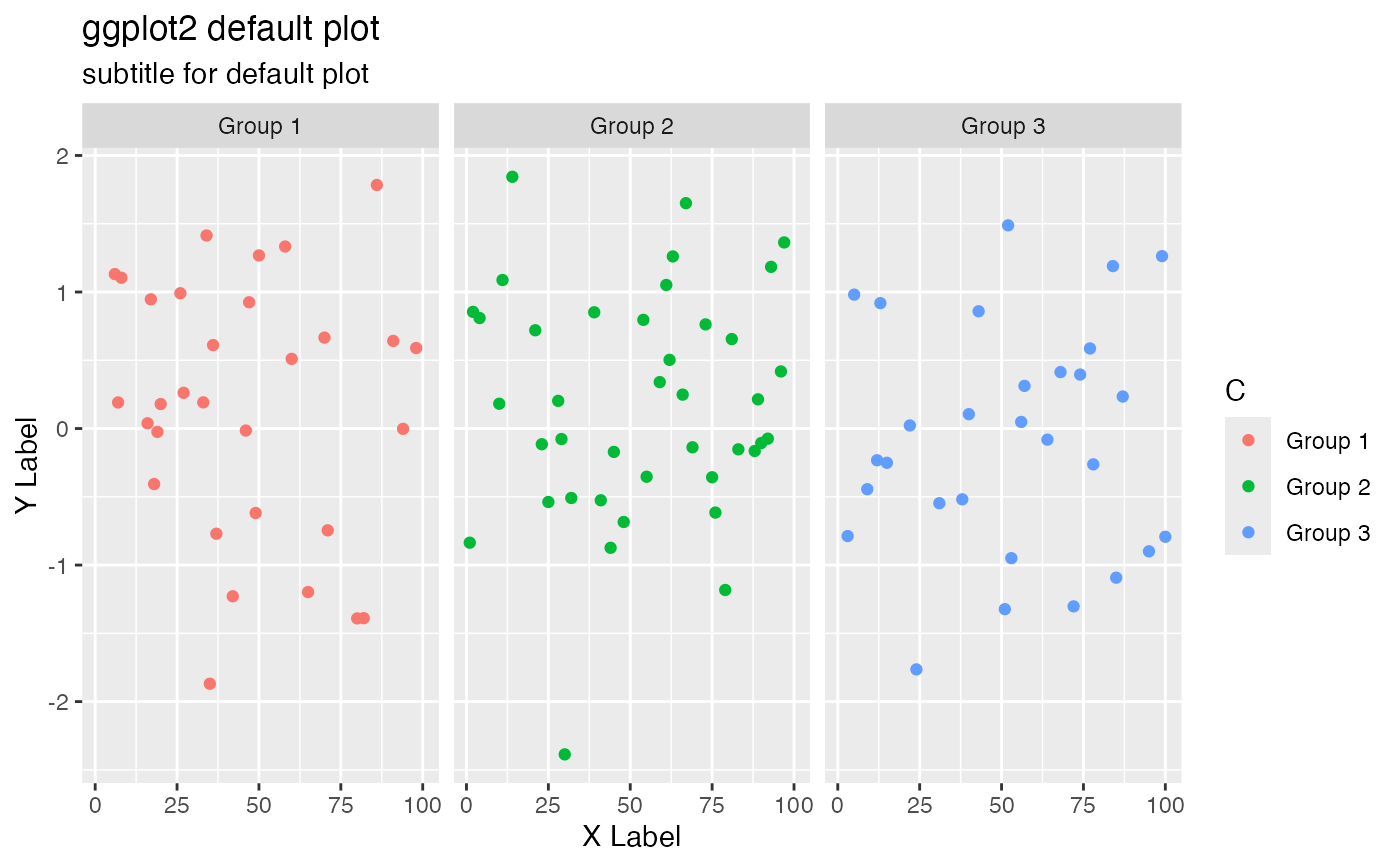
# Default ggplot2
ggplot(df, aes(X, Y, color = C)) +
geom_point() +
labs(
title = "ggplot2 default plot",
subtitle = "subtitle for default plot",
x = "X Label",
y = "Y Label"
) +
facet_wrap(~C)
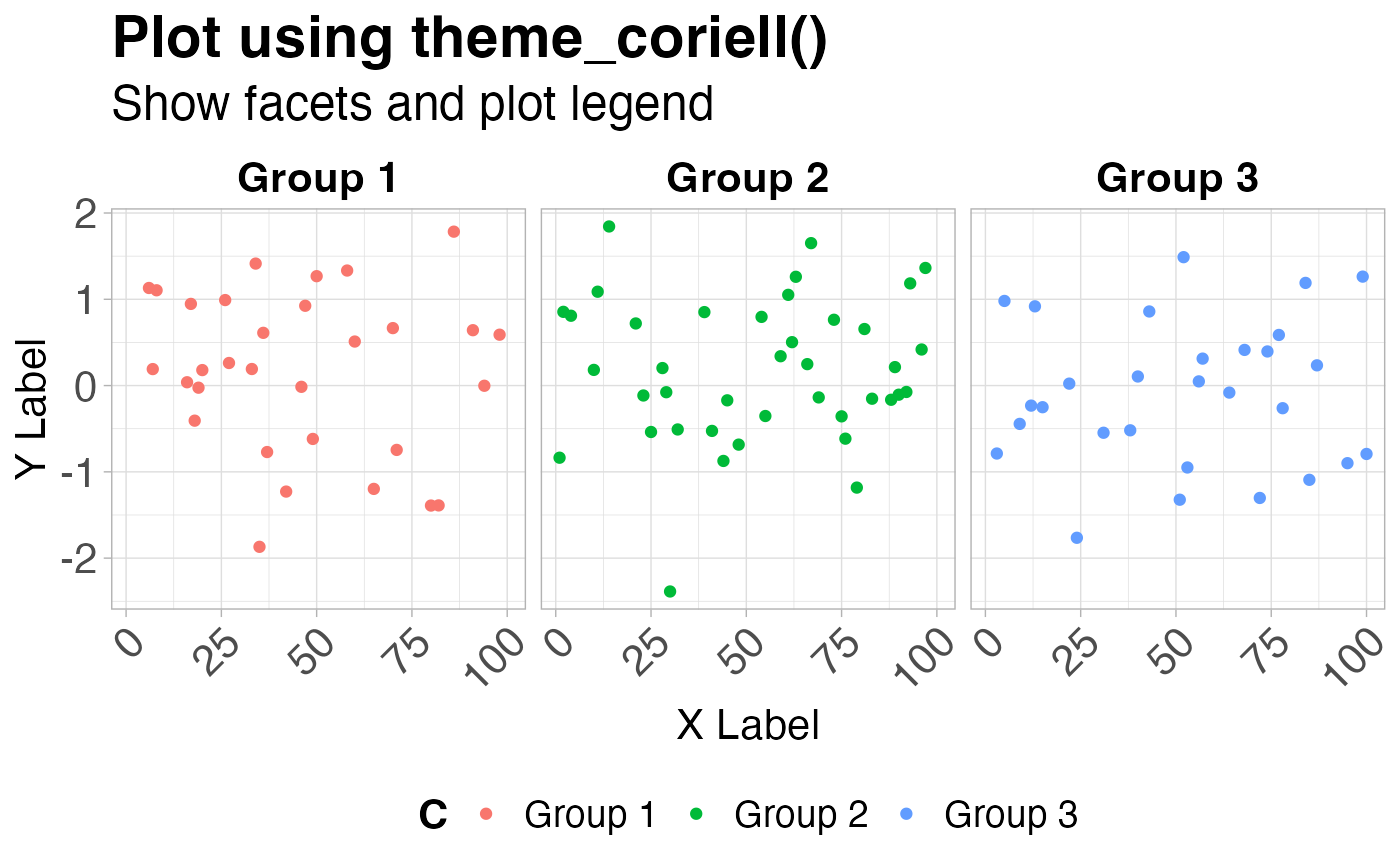
 # With theme_coriell()
ggplot(df, aes(X, Y, color = C)) +
geom_point() +
labs(
title = "Plot using theme_coriell()",
subtitle = "Show facets and plot legend",
x = "X Label",
y = "Y Label"
) +
facet_wrap(~C) +
theme_coriell()
# With theme_coriell()
ggplot(df, aes(X, Y, color = C)) +
geom_point() +
labs(
title = "Plot using theme_coriell()",
subtitle = "Show facets and plot legend",
x = "X Label",
y = "Y Label"
) +
facet_wrap(~C) +
theme_coriell()